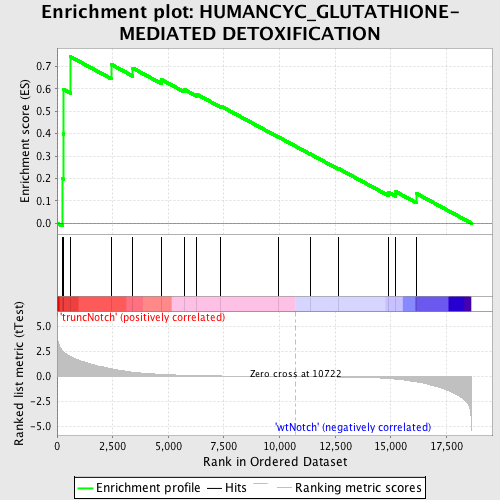
Profile of the Running ES Score & Positions of GeneSet Members on the Rank Ordered List
| Dataset | Set_03_truncNotch_versus_wtNotch.phenotype_truncNotch_versus_wtNotch.cls #truncNotch_versus_wtNotch |
| Phenotype | phenotype_truncNotch_versus_wtNotch.cls#truncNotch_versus_wtNotch |
| Upregulated in class | truncNotch |
| GeneSet | HUMANCYC_GLUTATHIONE-MEDIATED DETOXIFICATION |
| Enrichment Score (ES) | 0.7430259 |
| Normalized Enrichment Score (NES) | 1.5074674 |
| Nominal p-value | 0.020654045 |
| FDR q-value | 0.45418626 |
| FWER p-Value | 1.0 |
| PROBE | DESCRIPTION (from dataset) | GENE SYMBOL | GENE_TITLE | RANK IN GENE LIST | RANK METRIC SCORE | RUNNING ES | CORE ENRICHMENT | |
|---|---|---|---|---|---|---|---|---|
| 1 | GSTZ1 | 7000451 | 233 | 2.608 | 0.1990 | Yes | ||
| 2 | GSTM4 | 2340181 | 275 | 2.494 | 0.3990 | Yes | ||
| 3 | GSTA4 | 1660369 | 295 | 2.453 | 0.5969 | Yes | ||
| 4 | GSTT2 | 1580519 | 611 | 2.010 | 0.7430 | Yes | ||
| 5 | MGST2 | 2650129 | 2433 | 0.788 | 0.7091 | No | ||
| 6 | GSTM2 | 4730341 7650022 | 3405 | 0.437 | 0.6923 | No | ||
| 7 | MGST1 | 6020605 | 4688 | 0.223 | 0.6415 | No | ||
| 8 | GSTT1 | 5290520 | 5718 | 0.135 | 0.5971 | No | ||
| 9 | GSTA3 | 2470193 | 6272 | 0.106 | 0.5760 | No | ||
| 10 | GSTA2 | 2600047 6550139 | 7358 | 0.066 | 0.5230 | No | ||
| 11 | GGH | 4850373 6290152 | 9937 | 0.013 | 0.3855 | No | ||
| 12 | GSTM3 | 2570451 | 11367 | -0.010 | 0.3095 | No | ||
| 13 | GSTO1 | 6650600 | 12651 | -0.038 | 0.2436 | No | ||
| 14 | GSTP1 | 3170102 3710707 5080368 | 14900 | -0.186 | 0.1379 | No | ||
| 15 | MGST3 | 3450338 5290736 | 15225 | -0.248 | 0.1406 | No | ||
| 16 | GSTM1 | 1940332 6590463 | 16138 | -0.514 | 0.1332 | No |

